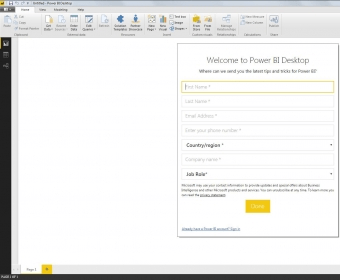
Power BI Desktop puts visual analytics at your fingertips with intuitive report authoring. Drag-and-drop to place content exactly where you want it on the flexible and fluid canvas. Quickly discover patterns as you explore a single unified view of linked, interactive visualizations.

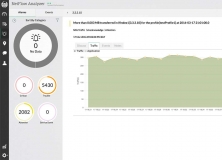
Analyse-it is a statistical analysis and regression tool for Microsoft Excel.


Comments